Award winning redesign of the W3C website
Between 2020 and 2022, Studio 24 worked with the iconic web standards body W3C on the redesign of their website.
Royal National Institute of Blind People (RNIB) is the UK’s leading sight loss charity. RNIB is a force for social change, supporting blind and partially sighted people, changing public perceptions, and helping make a world that is more accessible.
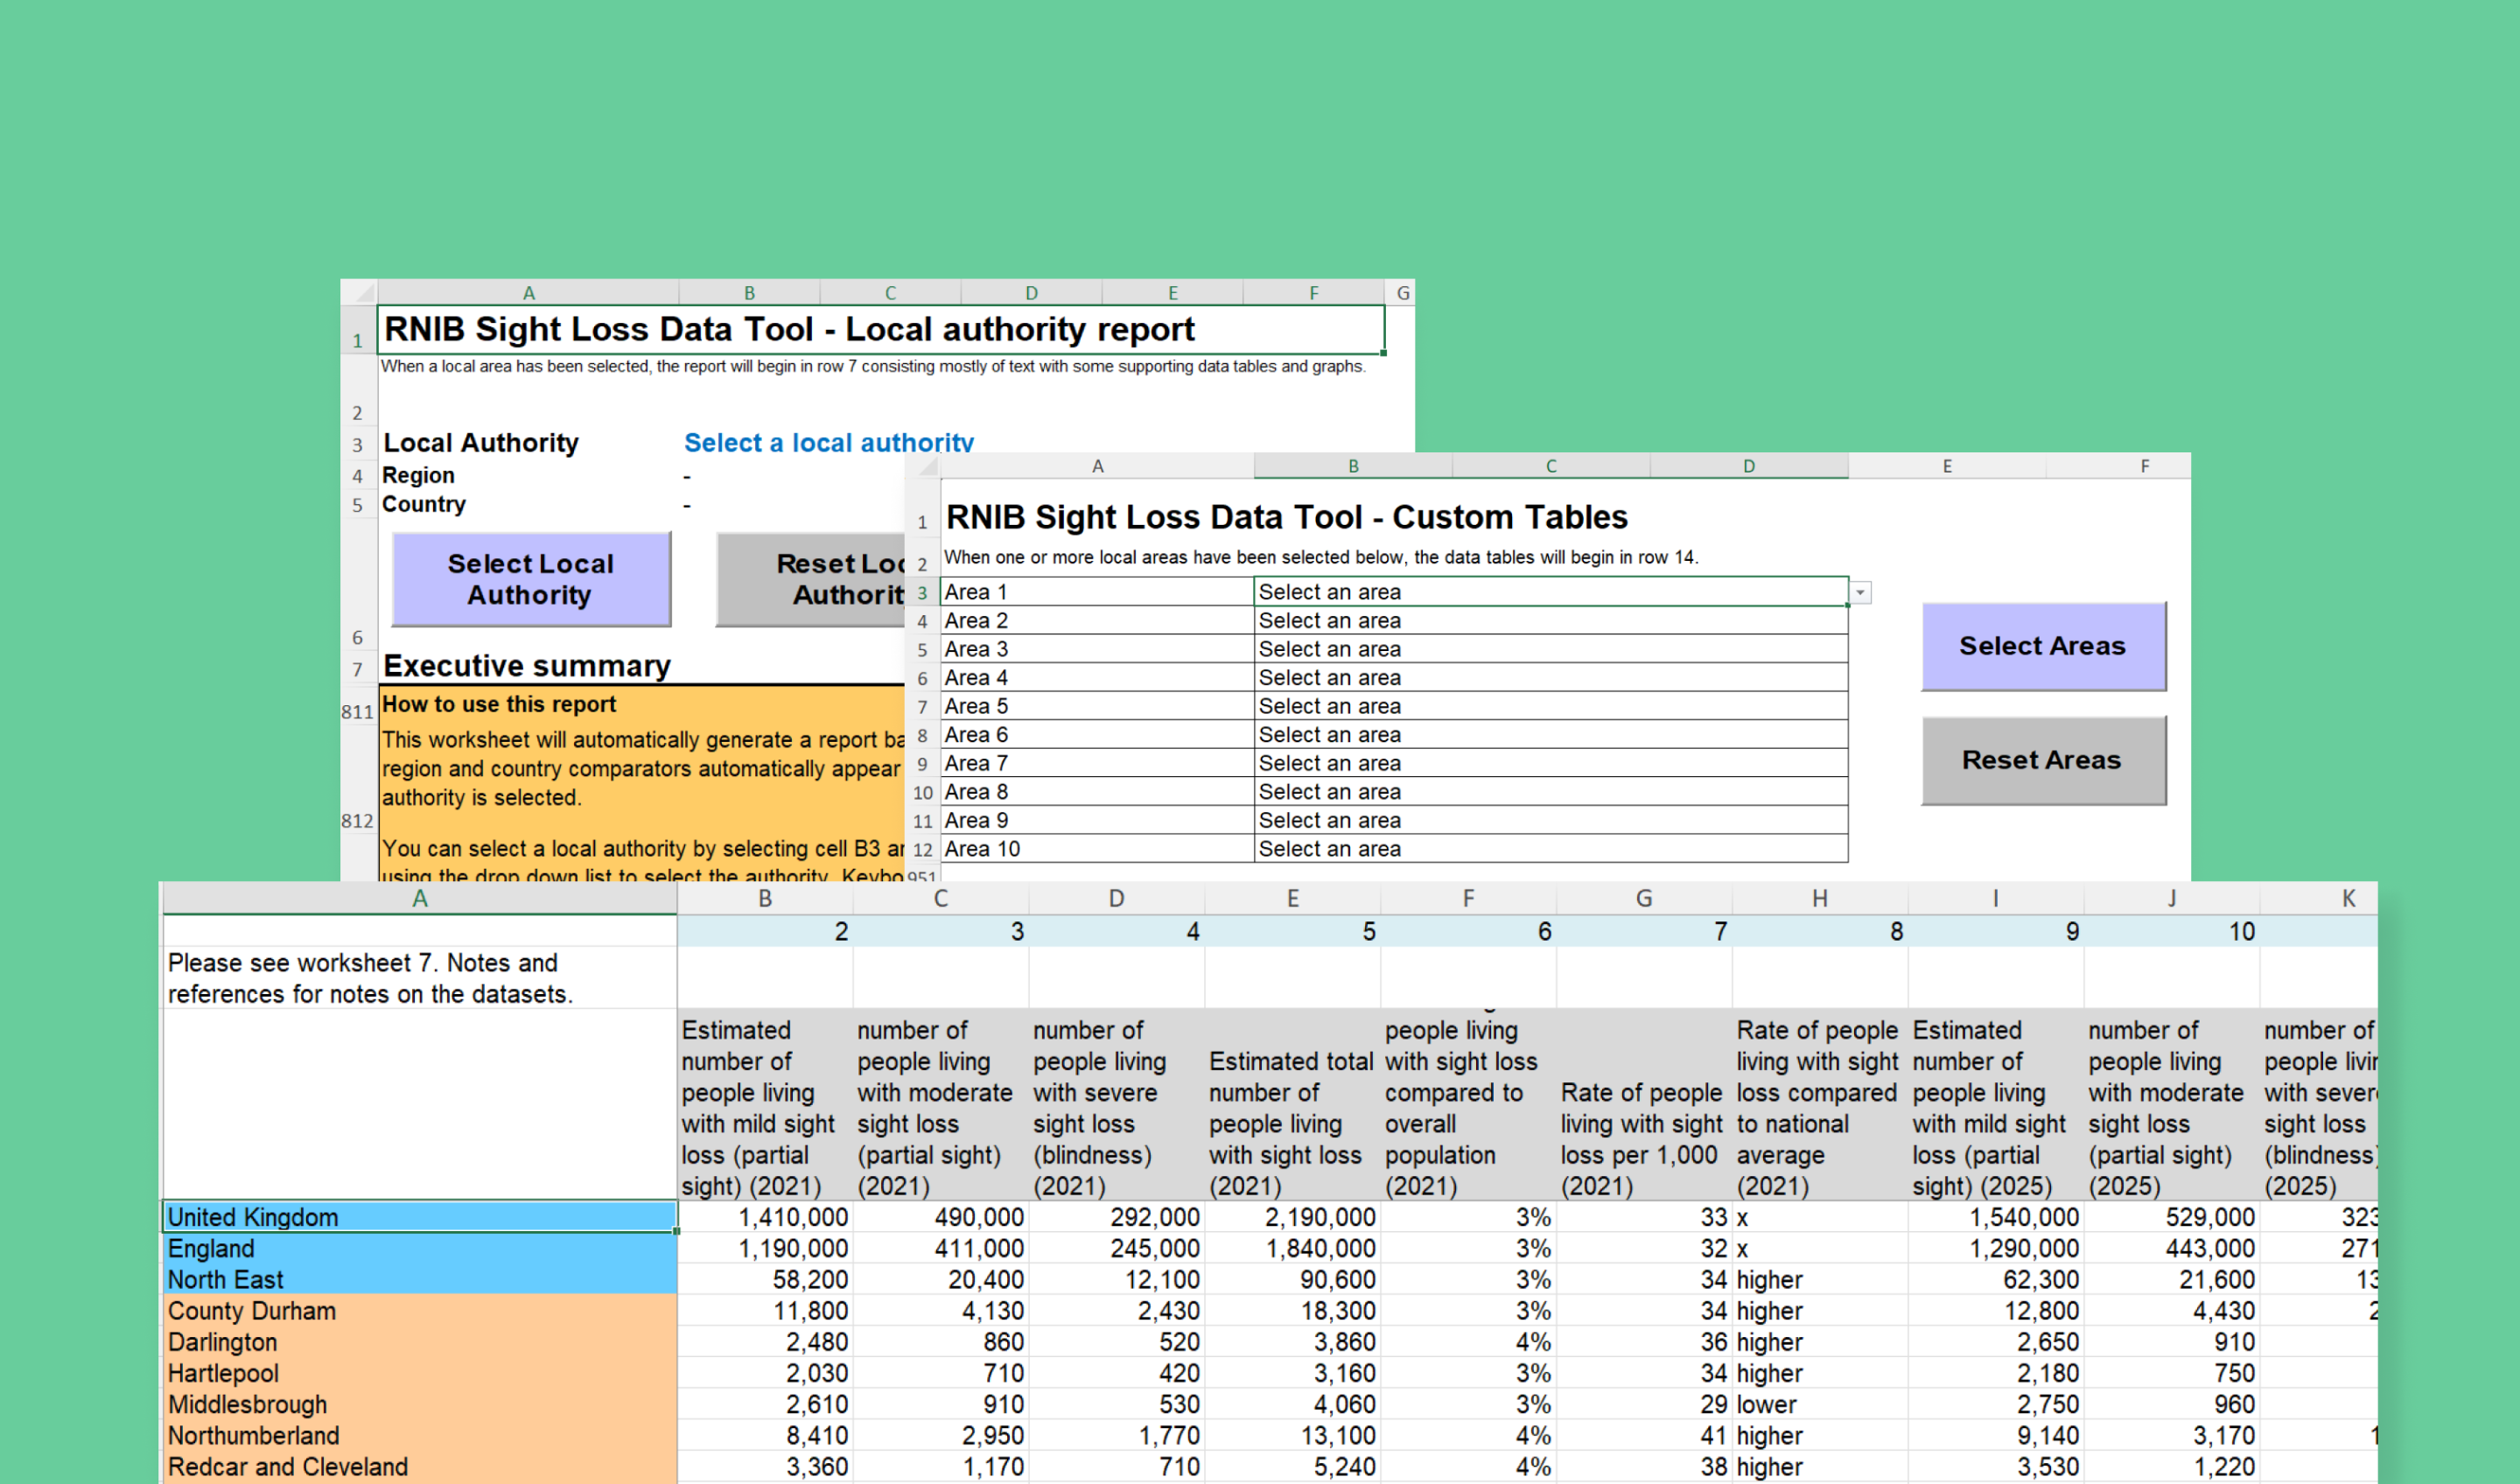
RNIB launched the Sight Loss Data Tool in 2013. It is the UK’s largest collection of eye health and sight loss data. It helps people understand eye health and sight loss at a local and national level.
The sight loss data was originally published as Microsoft Excel documents and static reports, which were time-consuming to create. For many years, the charity had been advocating for a more user-friendly, interactive data explorer to allow people to uncover sight loss insights.
RNIB also wanted an easy-to-manage system for their staff that provides analytics on who is using the data so they can understand the effectiveness of the tool and how it is being used.
This is our second project with RNIB. In 2025, we worked with them to rebuild the RNIB Bookshare service. The overarching experience of working with RNIB has been one of openness and brilliant collaboration, from start to finish. While this was mostly a different team, we had a great experience working on this project.
We took an agile approach to the project, starting with a Discovery to explore the requirements, followed by 2-week development sprints to build out functionality, regularly reviewing this with the RNIB team. This gave time for feedback to refine our approach and plan the next sprint and ensure we could make the data tool the best it could be.
In order to ensure we met RNIB’s needs, we created a set of user acceptance criteria in the Discovery phase to help clearly agree when our work met the desired outcome. These helped guide the work.
The sight loss data contains 364 data points across 100s of geographic regions of the UK (organised by local authority and health boards). There are around 84,000 individual data points in the dataset.
The RNIB data team converted the Excel documents into an Azure database, stored in the cloud. This helps ensure RNIB can manage the data effectively and supports future improvements.
Our team worked with RNIB’s data experts to understand the data, explore how it’s organised into geographic UK regions, and help validate any changes required to make this work efficiently on the web.
For this project, data was exported from the Azure database in CSV format. We built a tool to import this data into an SQLite database, offer a preview to admin users, and store it in the web application. Using SQLite allowed for fast development, which we made the most of in the prototyping stage. It also proved to be an efficient technology to use in production.
The whole team has been incredibly supportive, knowledgeable and patient in helping us move from mail‑merged spreadsheets to a fully functional and interactive website. They took the time to understand both our data and our requirements, working collaboratively with us to create something that is intuitive and inclusive.
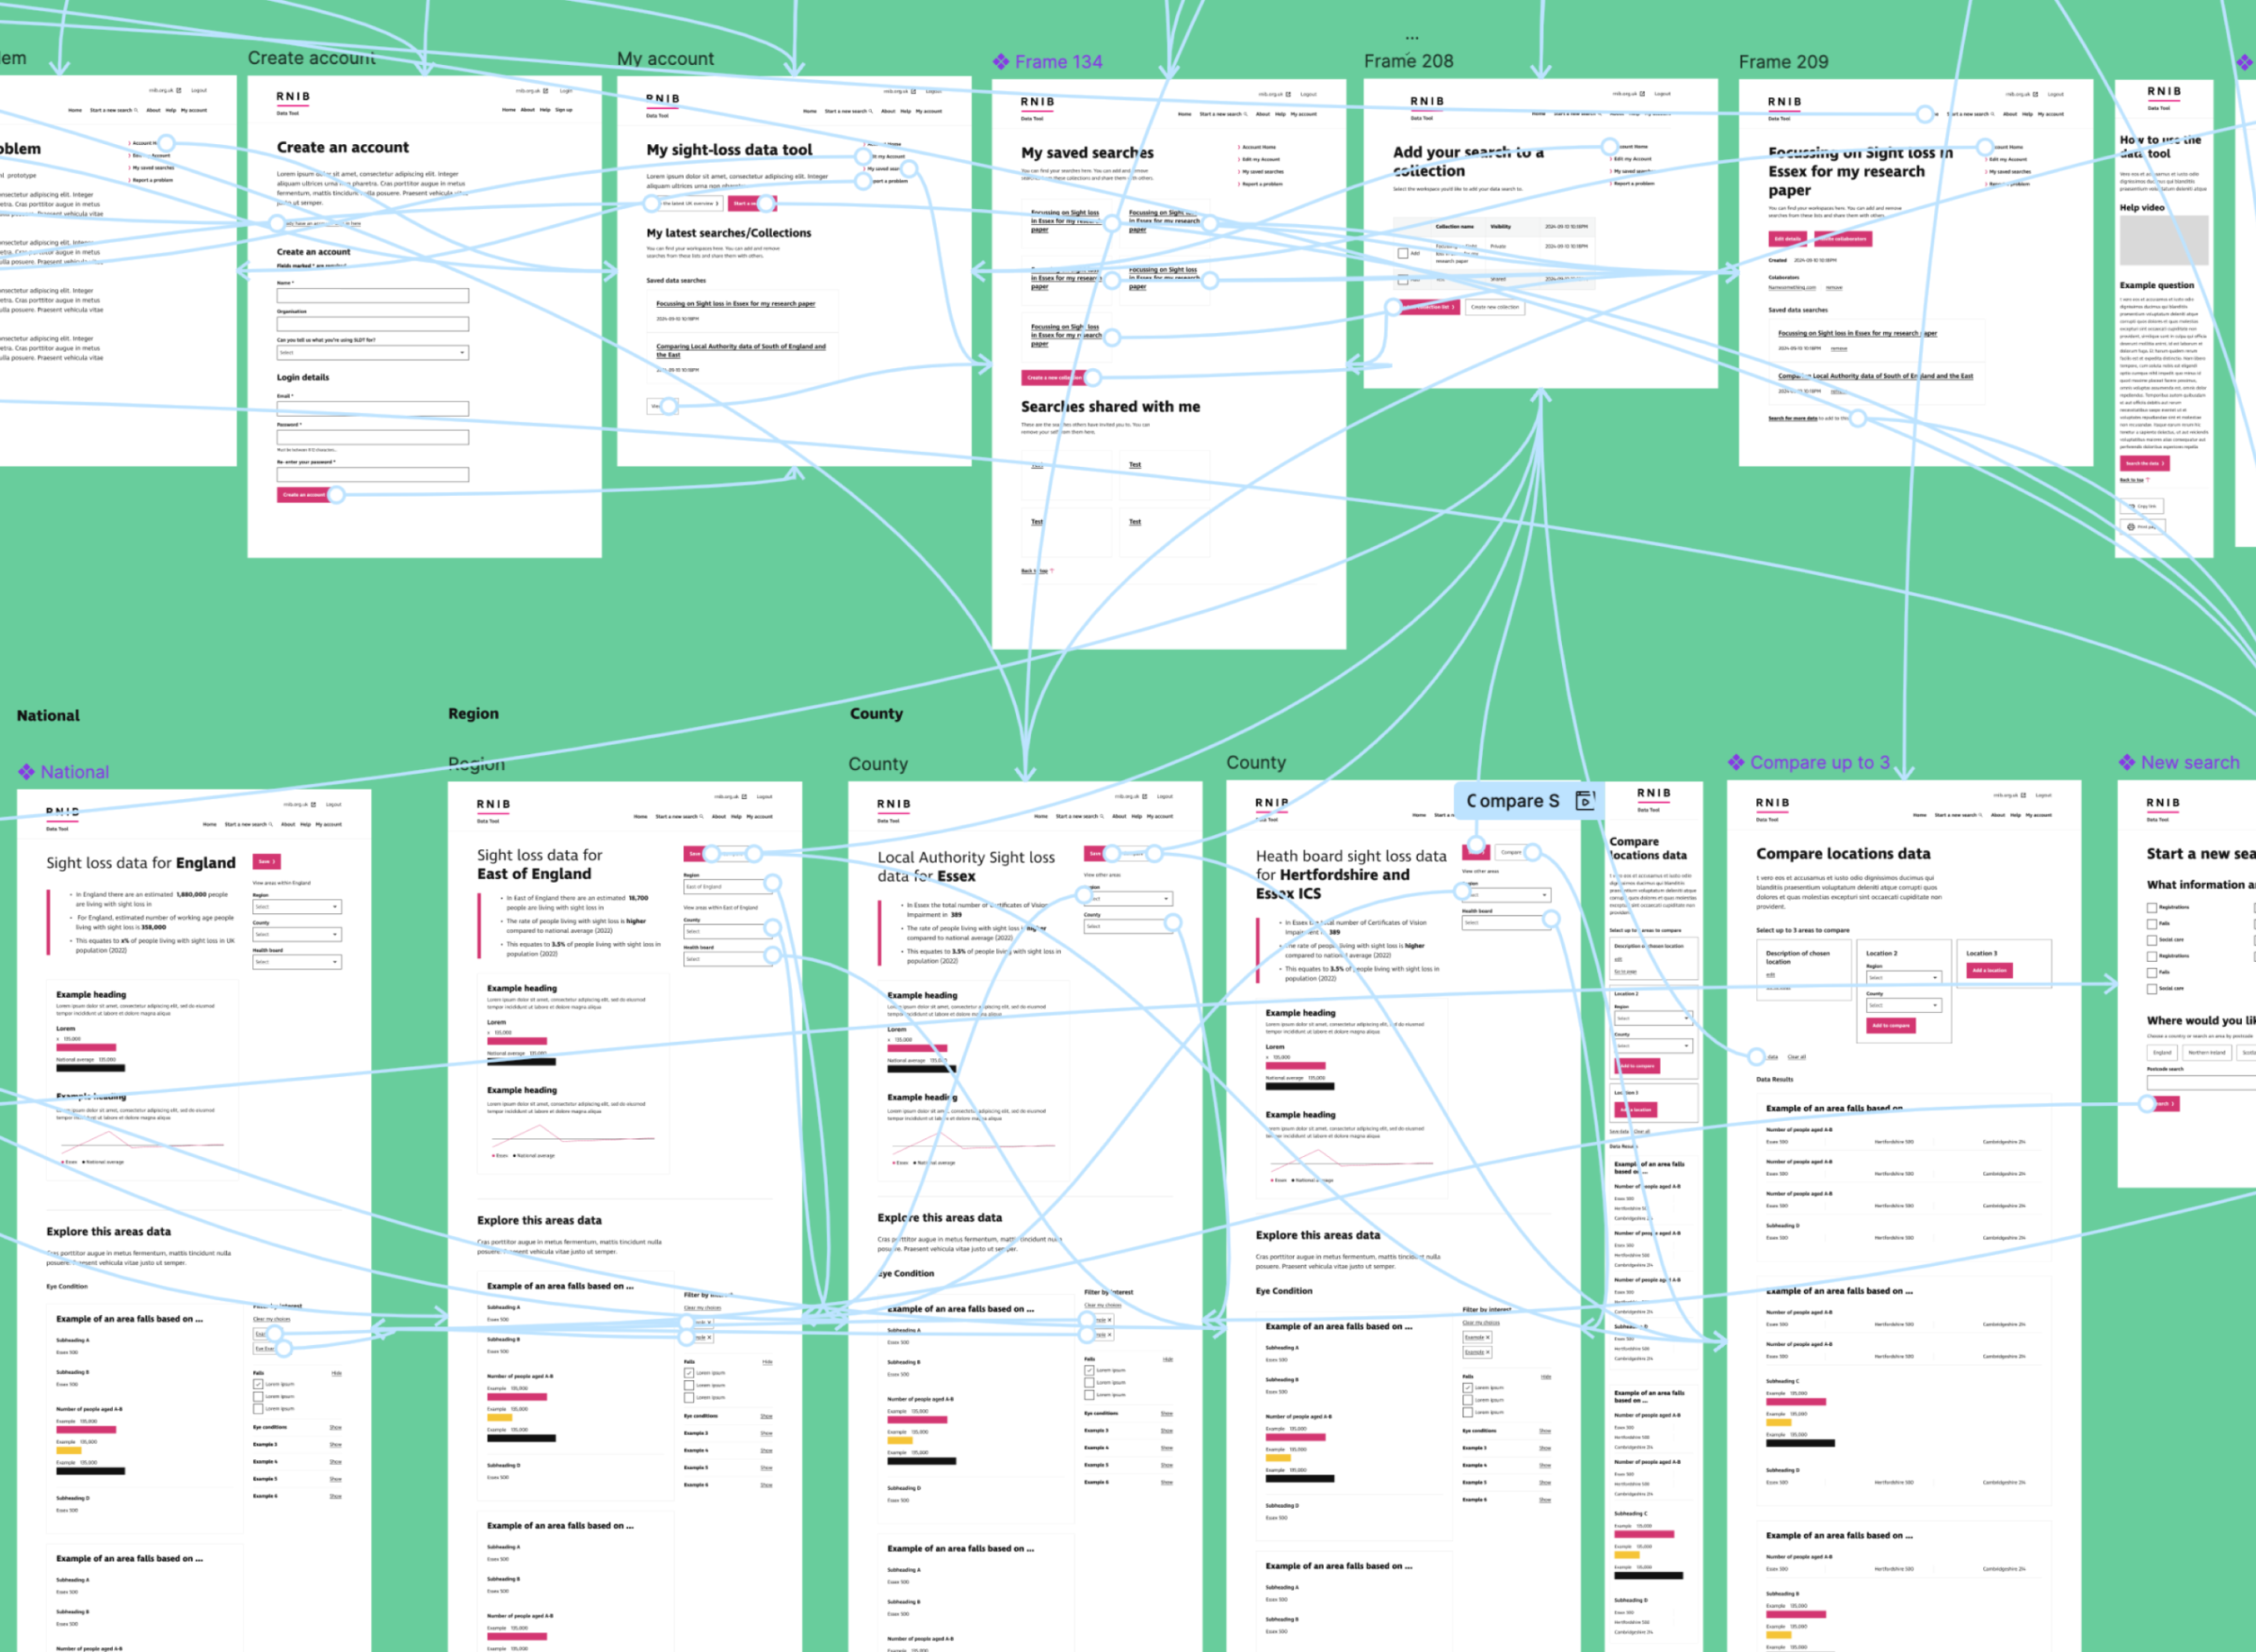
We started by wireframing the user journeys through the tool, exploring how users would navigate through the data and move between overview and detail. This helped us define a clear structure for how information should be accessed and compared.
We focused on transforming how the data is experienced online, moving away from raw spreadsheets and static tables towards a more intuitive, user-friendly interface.
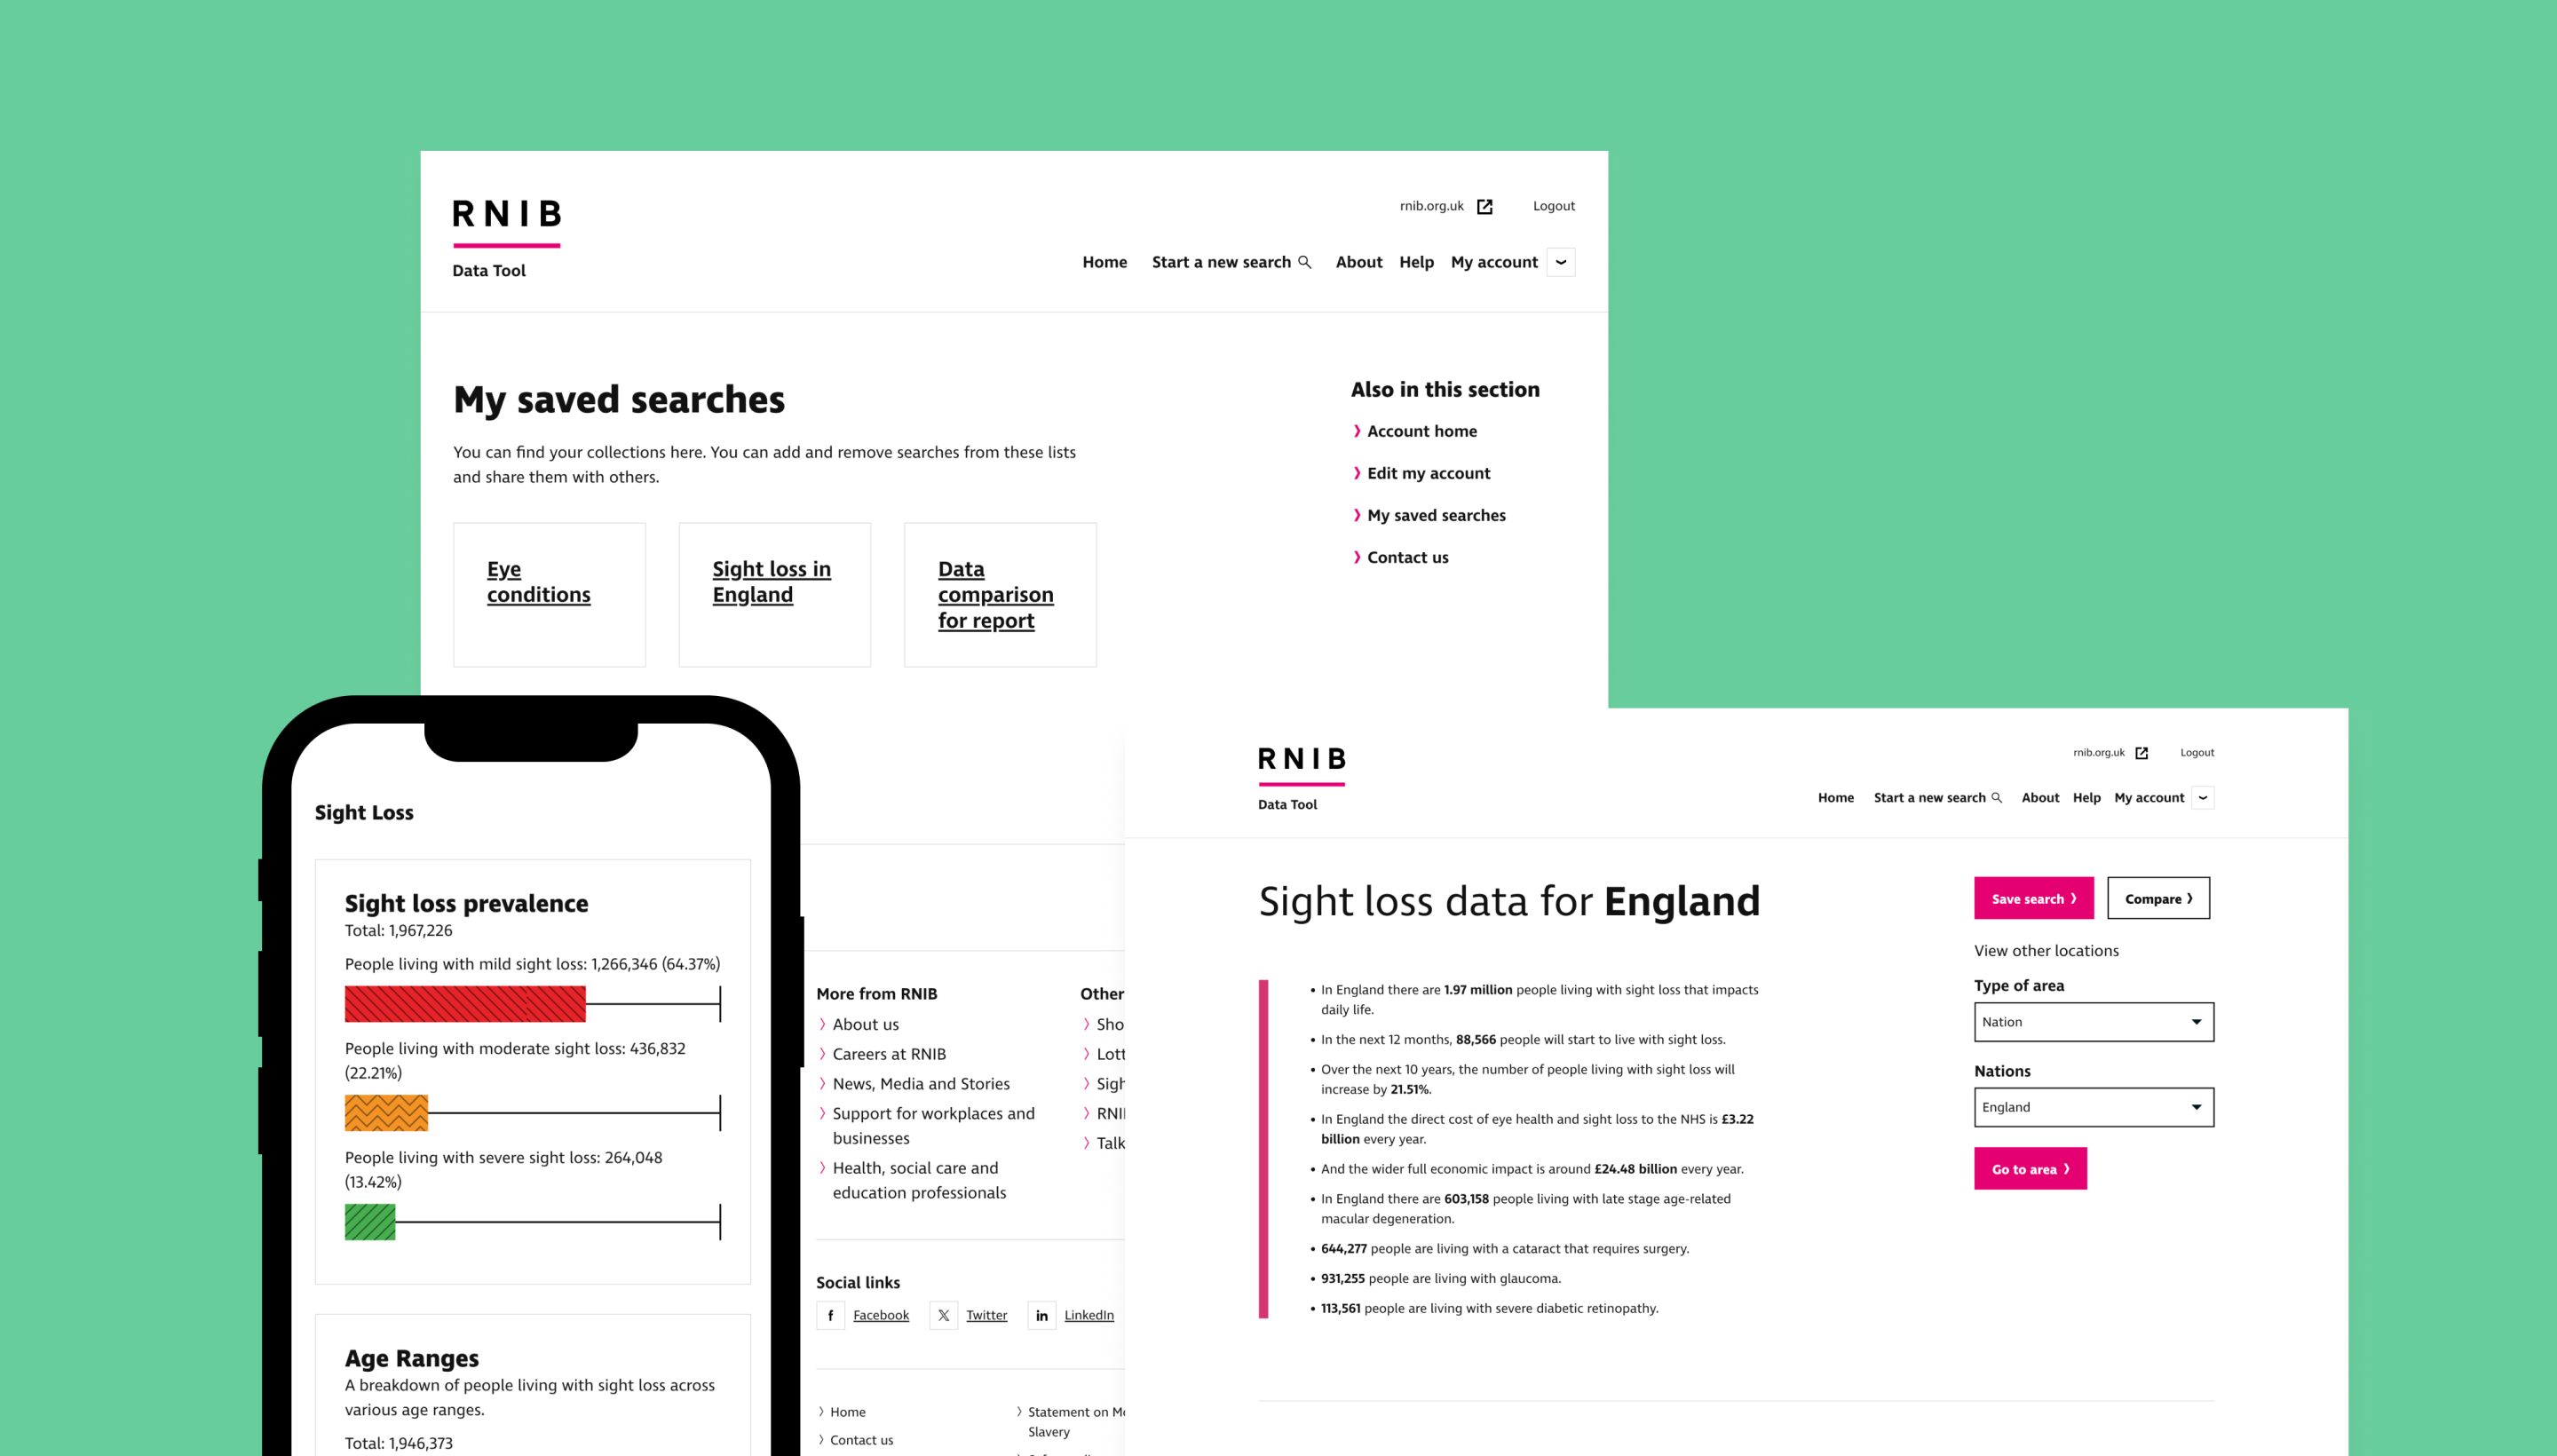
Rather than presenting users with large volumes of raw data, we introduced clear summaries and overviews to surface the most important insights at a glance. Each geographic area includes a high-level summary written in a more conversational, accessible style, helping users quickly understand what the data is telling them without needing to interpret detailed figures.
A key challenge was making the experience easy to use and digest on smaller screen sizes. We designed the interface to remain clear and scannable on mobile, ensuring users could still compare data and understand key insights without being overwhelmed, supported by accessible charting that helps visualise the data clearly.
We also structured the experience around simple, task-led journeys. Users can start by selecting an area of interest and then explore the data in a guided way, rather than being presented with everything at once.
A key part of the experience is the ability to compare datasets across regions. We designed this so users can easily select different areas and instantly see differences and trends side by side, without needing to work with spreadsheets or export data manually.
Throughout, we prioritised clarity and accessibility in how information is presented, ensuring the interface supports quick understanding as well as deeper exploration where needed.
In the early stages of the project, the data was still under development and we knew some requirements would evolve as we progressed. With this in mind, we started with a proof of concept that could be adapted as the client’s needs developed.
Gareth, the lead developer on the project, then built out the wireframes into a working prototype using live data to demonstrate how the sight loss data could be explored in practice. This was used to demo the tool to the RNIB team at a level that was accessible to both technical and non-technical stakeholders.
The RNIB sight loss data team then shared the prototype with wider internal teams, including colleagues with vision impairments, who were able to test and feed back on how accessible and usable the tool was in practice.
One of the most rewarding parts was taking something complex and dense, and shaping it into an experience that felt simple, clear and usable — without losing the richness of the data.
The user interface (UI) needed to make it easy for users to find the eye health and sight loss data they need.
Importantly, it had to be accessible, meeting WCAG 2.2 AA-Level. We worked with the client to ensure accessibility was prioritised throughout the project, including key functionality like keyboard access and using a screen reader.
We used RNIB’s existing web templates, based on the GOV.UK Design System, which we also used for RNIB Bookshare.
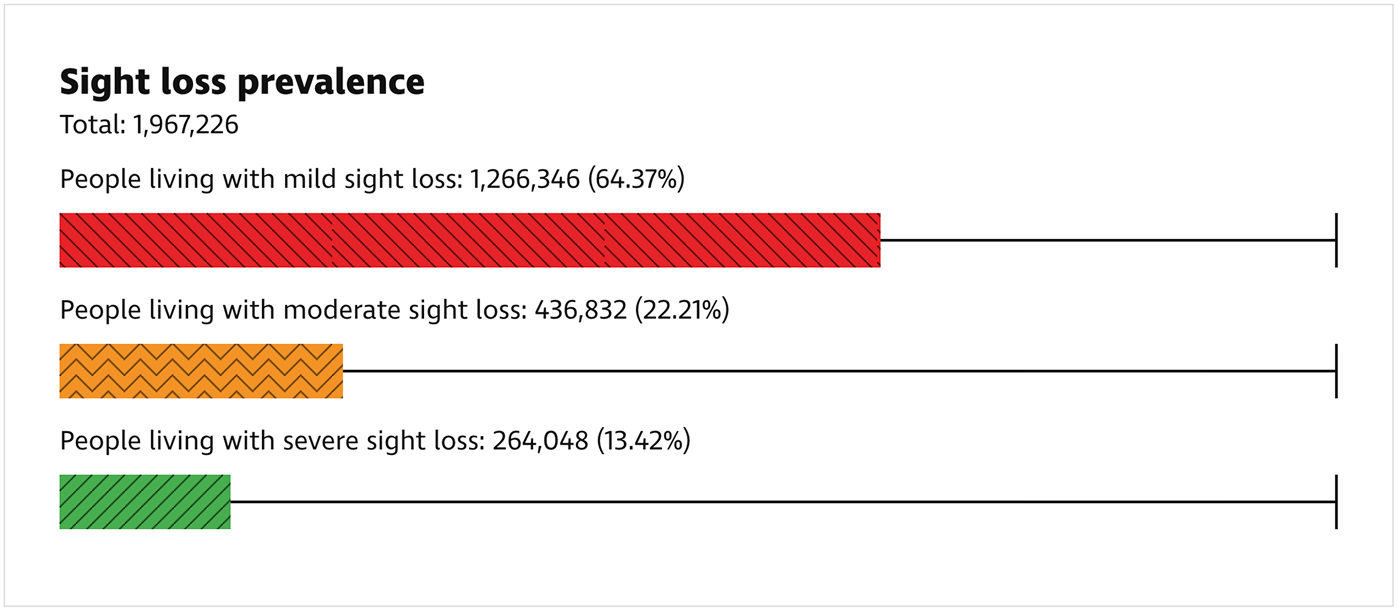
We needed to think about how to make the new data visualisations (e.g. bar charts) accessible. We reviewed a lot of different options. We decided to design the visualisations using HTML and CSS using proper structures and labels, as well as choosing colour schemes and patterns to keep accessibility levels high without relying on colour alone.
We built the final product using the popular open source web framework, Laravel, which we’ve used on lots of client projects. The Sight Loss Data Tool was custom-built to meet RNIB’s specific needs. Laravel makes this an efficient process, with many tools pre-built. We also used some of the learnings from our previous project on RNIB Bookshare to help speed up areas of the project.
The client wanted a more attractive way for users to search and read sight loss data online, as opposed to viewing or downloading an Excel document. The Excel files were very large, making it hard for users to find the data they wanted.
We built the search to allow users to query sight loss data in various regions of the UK, including by local authorities, health boards, and on a national level.
We integrated with MySociety’s MapIt service to enable users to search for data based on their postcode. The queries could be filtered on specific topics of interest, such as area profiles, future sight loss projections, and the economic impact of sight loss.
To search the data, users must register an account. In the explorer tool, data is returned as text summaries and visualisations, so it can be consumed in a variety of ways.
RNIB wanted users to be able to export data searches in an accessible format. We initially experimented with PDFs, but discovered most tools have a hard job of outputting the PDF/UA format (accessible PDFs). Given other priorities, we opted to export in Open Document Text (ODT) document, which can be read by Microsoft Word and other office tools.
It was great working in an agile way with RNIB. The cycles of reviewing and planning were very collaborative and we have a very productive partnership where we can challenge each other to improve the development of the tool.
We added functionality that allows users to collaborate by creating a workspace where saved reports can be shared, new reports added, and old reports deleted. If users aren’t already registered they are guided through the registration process.
This collaboration isn’t possible in an Excel document, so the new tool gives users a more useful, more refined experience.
We built an accessible, lightweight page editing tool in Laravel so the RNIB team can update page content. We chose this approach because we wanted something really simple, a CMS like WordPress or Craft has too much functionality for this project.
We added analytics, so the RNIB team can see how people use the data tool. Plus all user activity for logged-in users is stored in an audit log, so the admins can understand how the tool is being used and by whom.
We created multiple levels of user permissions and used two-factor authentication for added security.
Admin users can upload new sight loss data as CSV files and release new versions of their data to the public. We made the process simple with as few steps as possible. Data is validated on upload. A new version can be previewed before it goes live, whilst the historical versions are stored. No developer support is required, giving the RNIB team full autonomy.
In the first week following the launch
users signed up – halfway to the annual target!
datapoints in an intuitive and inclusive tool.
data update, which worked flawlessly.
This is a tool that looks simple on the surface but is underpinned by a complex dataset, which is a real achievement. We’re already seeing strong take‑up and very positive feedback, and we’re confident the platform will continue to grow and evolve. I’m really looking forward to working with Studio 24 in the future as the Sight Loss Data Tool develops further.