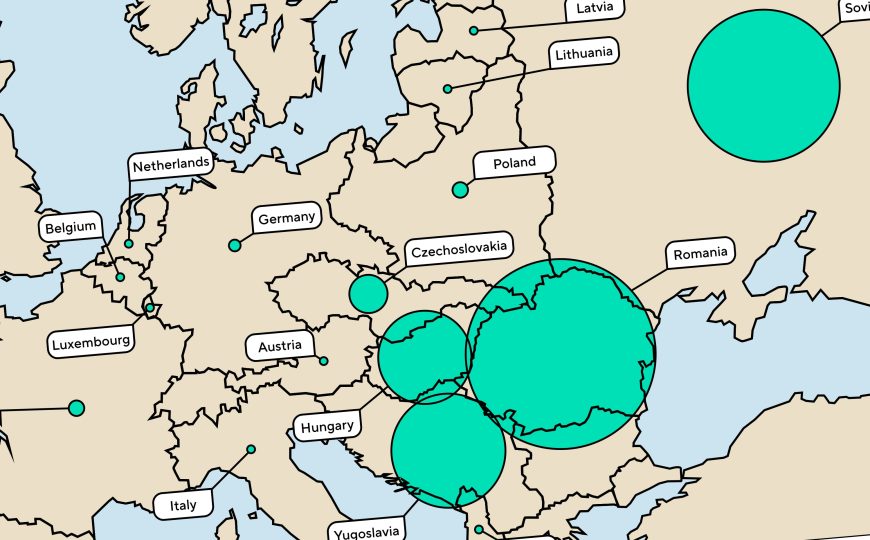
Designing maps to represent important aspects of WW2 and the Holocaust
We designed a set of clear and attractive historical maps, based on The Wiener Holocaust Library’s historical research.

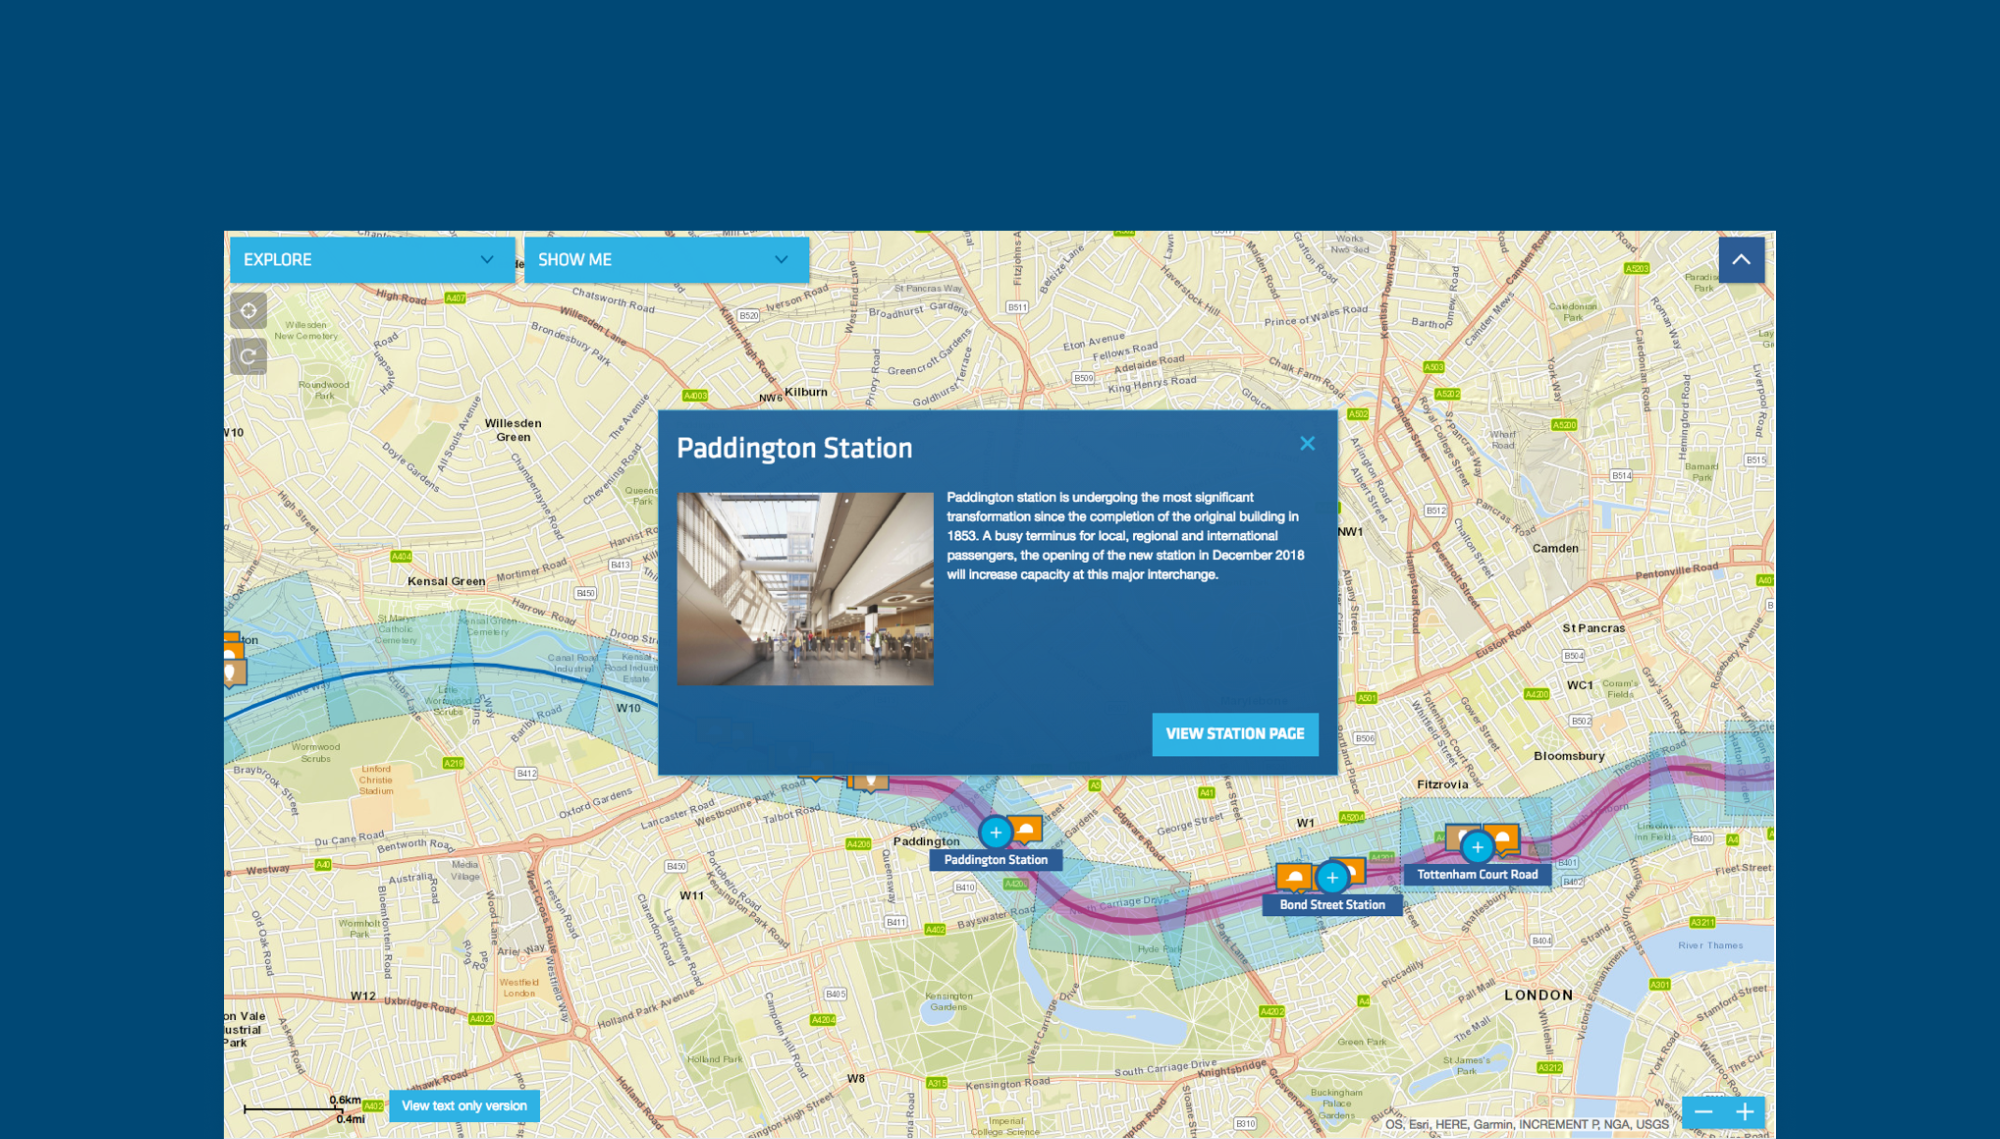
We worked with the team at Crossrail Ltd to develop a user-friendly, responsive and interactive map that highlights the detail and the scope of the Crossrail project
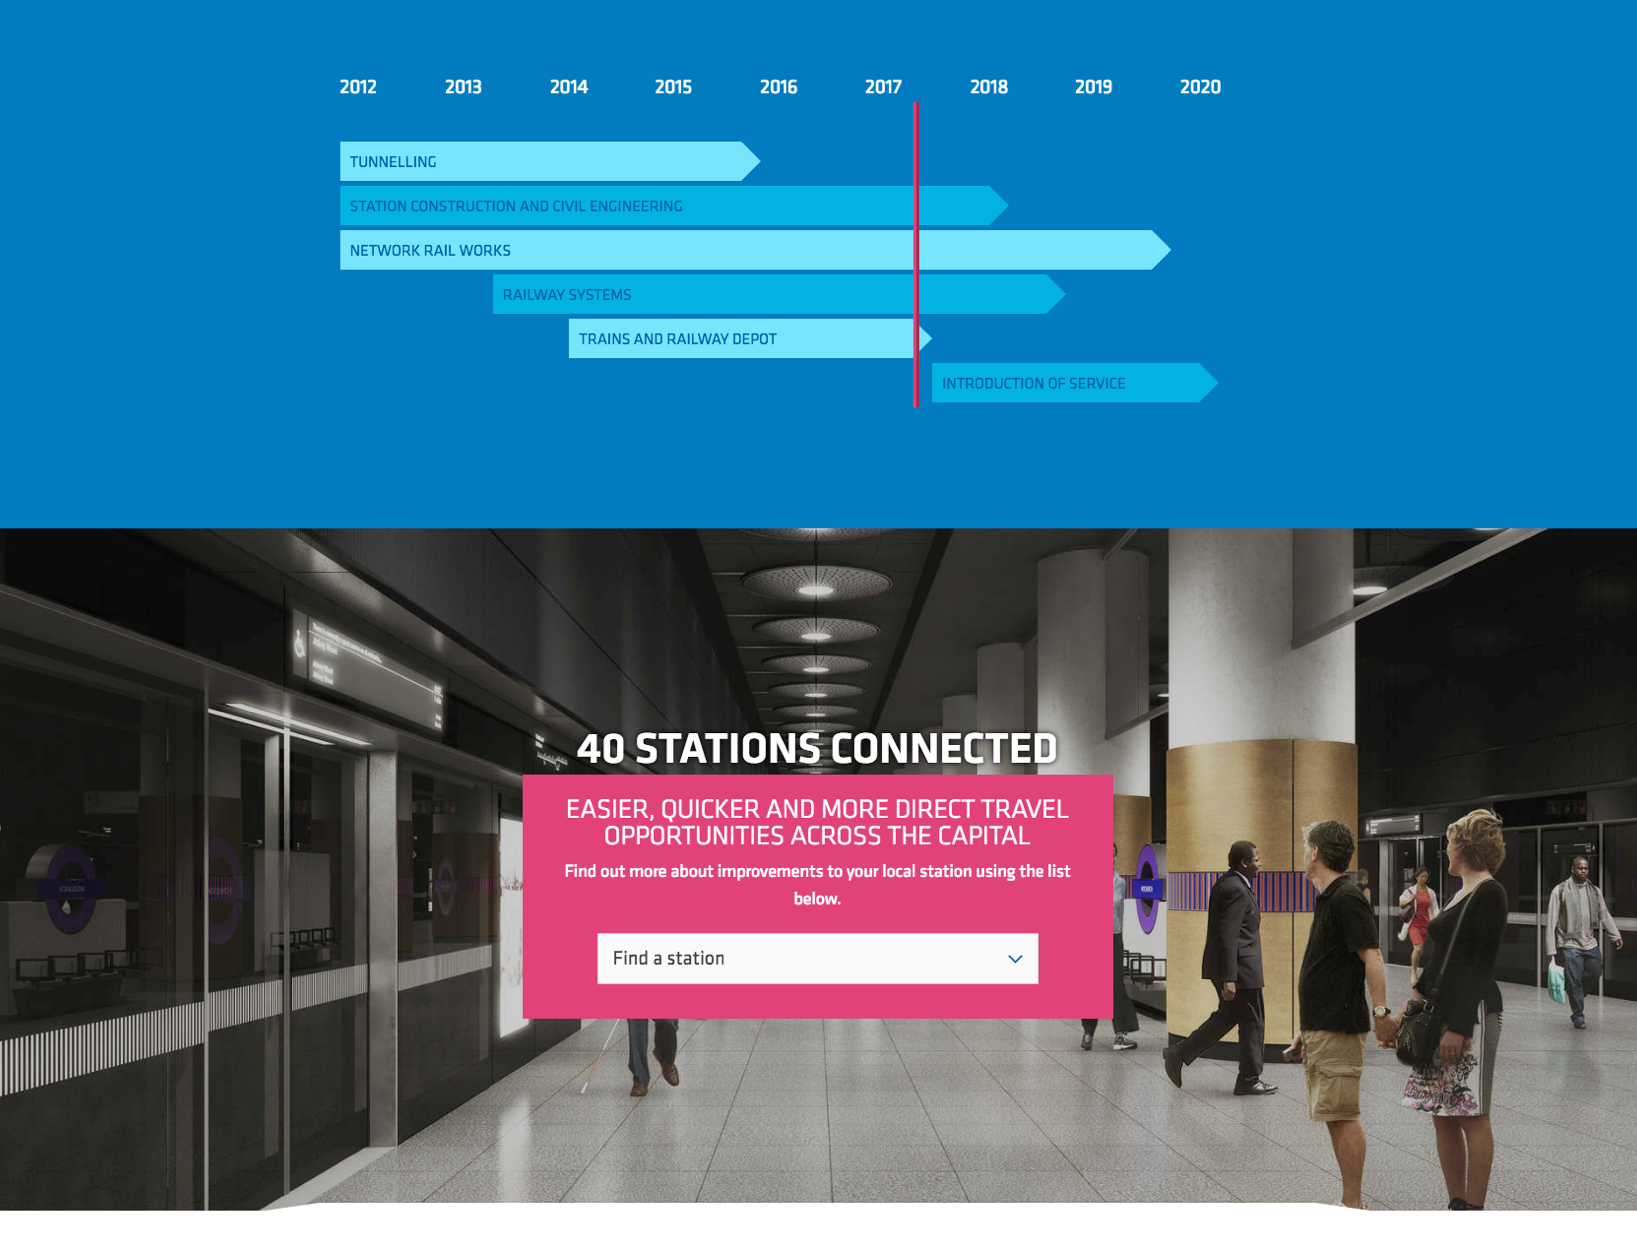
During the construction period, Crossrail was the largest railway infrastructure project in Europe. Trains travel on the Elizabeth Line from Reading and Heathrow in the west to Shenfield and Abbey Wood in the east, via new twin tunnels under central London.
Studio 24 worked with Crossrail for 13 years, and the interactive map project was a critical part of the long-term digital work we did for them. It had three major releases between 2010 and 2015 as we responded to changing client requirements.
You can visit the Crossrail interactive map on the Internet Archive.
The goals for an interactive online map are:
In 2010, we developed a custom CMS for the Crossrail website to help model the complex content required on the Crossrail website. The CMS had good support for multimedia and geo-tagging content, which helped us to build the interactive map.
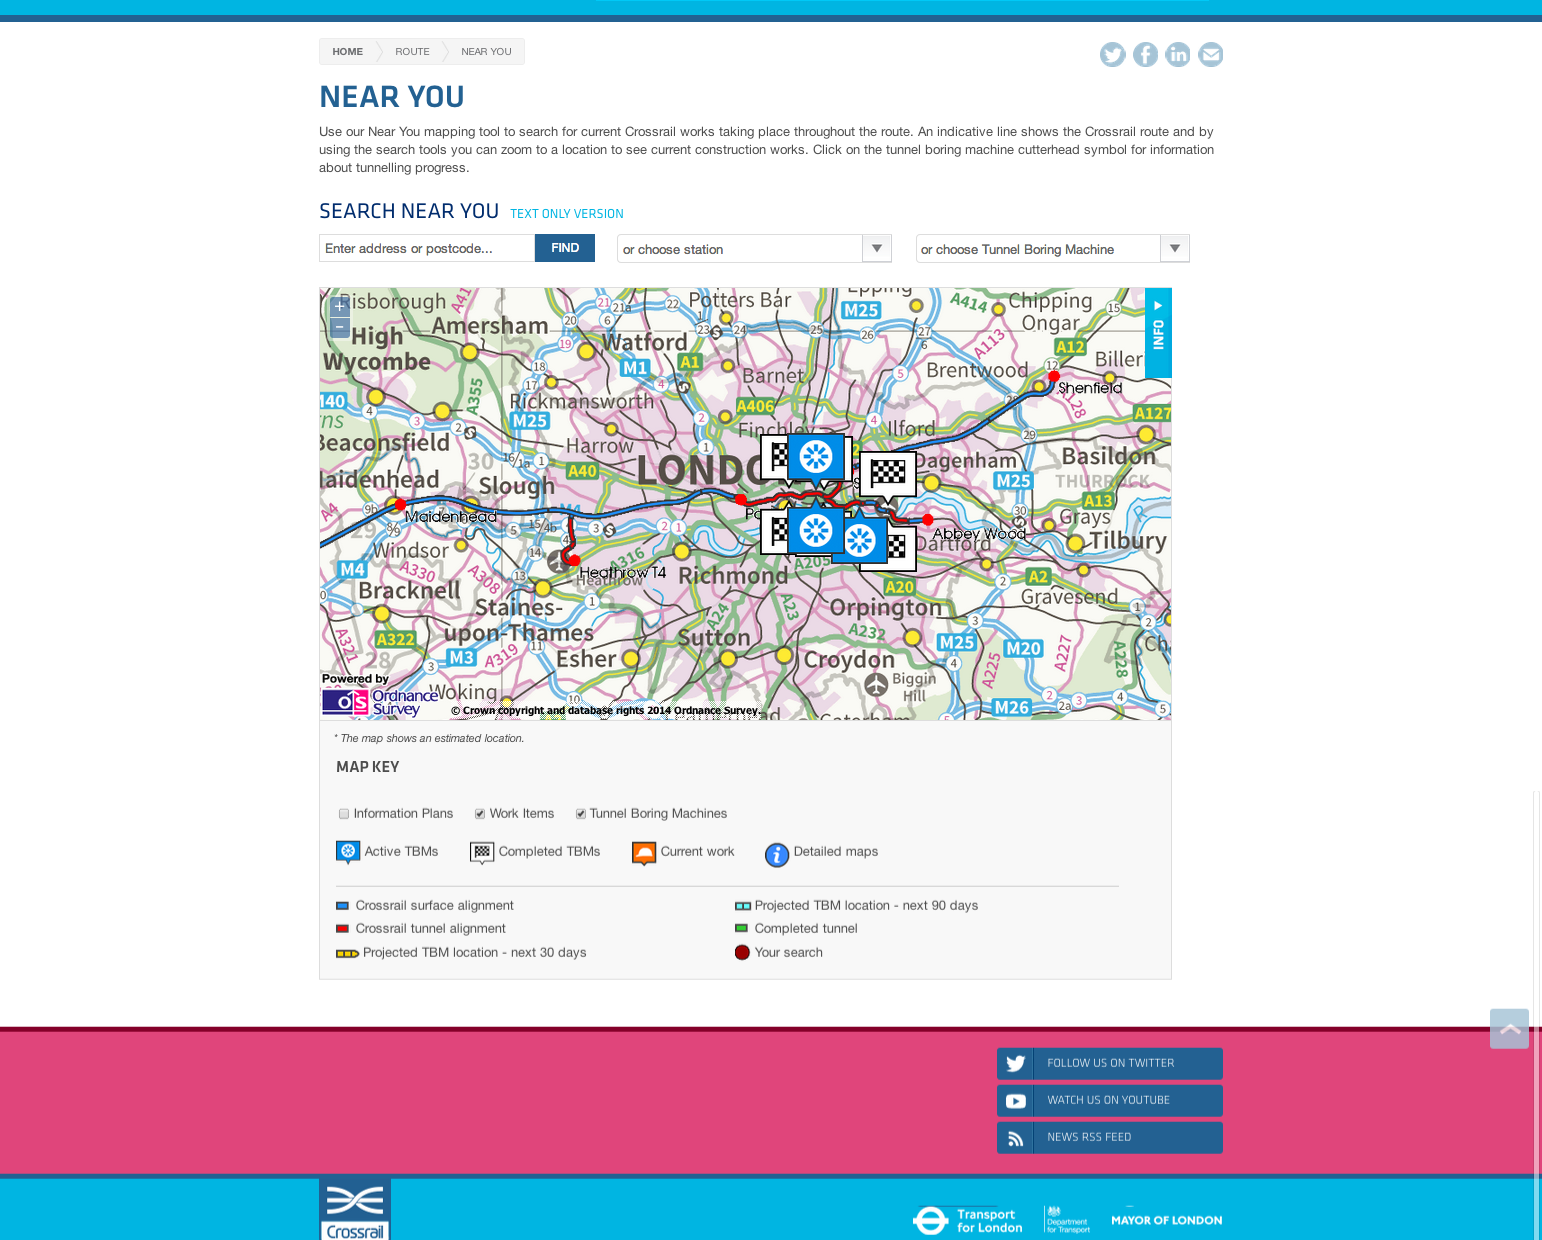
We built the first interactive map using Ordnance Survey (OS) online maps. This service was chosen since data on the Crossrail map was derived from OS, so we could not legally use other services such as Google Maps. Map data was supplied by the Geographic Information System (GIS) team at Crossrail, using GeoServer, a Java-based open source geospatial service.
While developing the map, some critical data, such as the location of the tunnels, was off by up to 5 metres. We discovered this was due to the differences in map projections used on the online map and the supplied GIS data.
We love this sort of challenge! Working with GIS technology specialists, we were able to overcome these critical issues and could then progress to the design and content of the interactive map.
We plotted the live location of the tunnel boring machine (TBMs) on the map of London. This data was managed via our CMS and showed the last TBM location accurately to within a day.
We also created an accessible text-only version so users can access the information where there is a slow internet connection or if the user cannot use the interactive map.
The original map was really successful and had lots of positive feedback from users.
Traffic to the Crossrail website from mobile had been doubling year on year since 2010, by 2013 around 30% of users were using mobile and by 2015 this was 50%. Responsive design had been gaining traction since Ethan Marcotte’s A List Apart article.
In late 2012, we embarked on a mobile-friendly redesign of the Crossrail site, which launched in Jan 2013.
The key feature was to make the map responsive, no easy feat with the complexity of an interactive map. We moved from an embedded map on a page to a full-screen map which gives more space to the user on smaller devices.
We also switched the map service to ESRI mapping, which is more flexible than Ordnance Survey’s service.
While we were working on the responsive redesign we also took the opportunity to add more content, including information about how the tunnels were constructed and details of the different archaeological finds uncovered during the construction of the railway.
We continued to iterate on the map, responding to changing business requirements and user feedback. By 2015, a refreshed design was launched across the Crossrail website, including the interactive map.
Following the completion of TBM tunnelling in 2015, we removed the tunnel boring machine location and focused on improving the usability to make it easier to find content.
To make a better user experience, we:
The result is a highly successful interactive mapping tool which has proved to be the most popular section of the Crossrail website after the homepage. We used our experience working with GIS teams and different mapping technologies to create a simple, easy-to-use online map for users.
The iterative approach in the design and development was essential to the success of this project; it resulted in a better quality product and better value for money for the client.
Read more about how interactive maps can improve stakeholder engagement on our blog or get in touch about an interactive map for your project.